Cluster Locations Using K-Means
The function takes a CSV of data collection locations and clusters locations into n groups, where n is specified by the user. n can be n_workers, n_workers*n_days etc. The function uses k-means to cluster the locations, and defaults to the euclidean distance matrix.
Input:
nor number of clusters- A CSV file containing the lat/longs of the remaining points. For instance, output of geo_sampling with a few adjustments can work. The geo_sampling script produces a list of segments with a start and an end lat/long of each segment. Pick the start or end lat/long and rename columns so that they are 3 columns with names: id, lat, long
- Distance function:
-d euclidean,-d haversineor-d osrm. Default is-d euclidean. - Name of the output file. Default is
cluster-kmeans-output.csv
Output:
- Appends a new column
assigned_pointsthat gives cluster assignment for each row of the lat/long file. The column takes integer values:1, 2, 3, ....n
Usage:
usage: cluster_kmeans.py [-h] -n N_WORKERS [-m MAX_ITER]
[-d {euclidean,haversine,osrm}] [-c CENTROIDS]
[-o OUTPUT] [-r RANDOM_STATE] [--plot]
[--osrm-base-url OSRM_BASE_URL]
[--osrm-max-table-size OSRM_MAX_TABLE_SIZE]
input
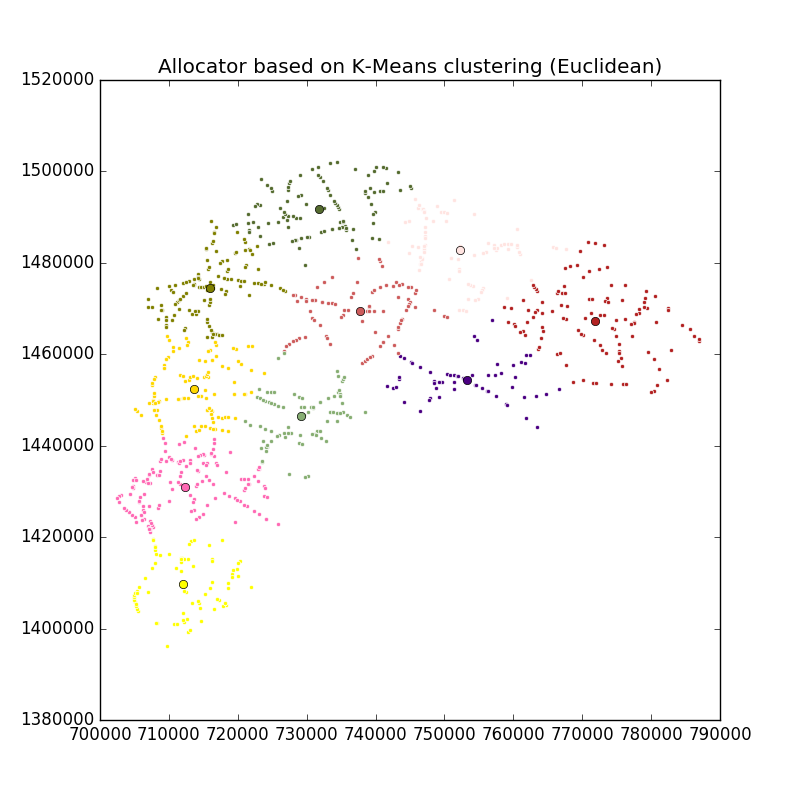
Random allocator based on K-Means clustering
positional arguments:
input Road segments input file
optional arguments:
-h, --help show this help message and exit
-n N_WORKERS, --n_workers N_WORKERS
Number of workers
-m MAX_ITER, --max_iter MAX_ITER
Maximum number of iterations
-d {euclidean,haversine,osrm}, --distance-func {euclidean,haversine,osrm}
Distance function for distance matrix
-c CENTROIDS, --centroids CENTROIDS
Output file name of K-Means centroids
-o OUTPUT, --output OUTPUT
Output file name
-r RANDOM_STATE, --random-state RANDOM_STATE
Random state
--plot Plot the output
--osrm-base-url OSRM_BASE_URL
Custom OSRM service URL
--osrm-max-table-size OSRM_MAX_TABLE_SIZE
Maximum OSRM table size
Examples:
python -m allocator.cluster_kmeans -n 10 allocator/examples/chonburi-roads-1k.csv --plot
Output file will be saved as cluster-kmeans-output.csv if a different name is not specified by -o/--output. K-means centroids will be saved as cluster-kmeans-centroids-output.csv if another name is not specified by -c/--centroids
To see the plot, please specify --plot