Sort By Distance
The function takes workers’ current locations and a file containing lat/long of locations and does one of two things:
- Produces an ordered list of workers for each location—ordered by proximity to the location, closest to furthest. An administrator could use the ordered list to propose other workers if the most proximate worker can’t go a particular location.
- Produces an ordered list of locations by worker—ordered by proximity to the worker. The ordered list works as a simple recommendation engine—suggest other locations that a worker could collect data from.
Note. If 2 or more workers/locations are equally far away, the order is assigned randomly.
Input:
- A CSV file containing the lat/longs of the remaining points. For instance, output of geo_sampling with a few adjustments can work. The geo_sampling script produces a list of segments with a start and an end lat/long of each segment. Pick the start or end lat/long and rename columns so that they are 3 columns like below.
- A CSV file containing initial_location for workers. Must have three columns with names:
lat,long - by_worker flag. If the by_worker flag is included, the script produces an ordered list of locations by worker. Default: ordered list of workers by location.
- Distance function:
-d euclidean,-d haversineor-d osrm. Default is-d euclidean. - Name of the output file. Default is
sort-by-distance-output.csv
Output:
- By Default (if
--by_workerflag is not planted), it appends to the location CSVn + 1(n = n_workers) new columns. The first n column contains distance between the location and the n’th worker. The last column contains a semi-color separated ordered list of workers. - If the
--by_workerflag is planted, it appends to the worker CSVk + 1(k = n_locations) new columns. The first k column contains distance between the worker and the k’th location. The last column contains a semi-color separated ordered list of locations.
Usage:
usage: sort_by_distance.py [-h] -c CENTROIDS [-o OUTPUT]
[-d {euclidean,haversine,osrm,google}] [--plot]
[--by-worker] [--osrm-base-url OSRM_BASE_URL]
[--osrm-max-table-size OSRM_MAX_TABLE_SIZE]
[--api-key API_KEY]
input
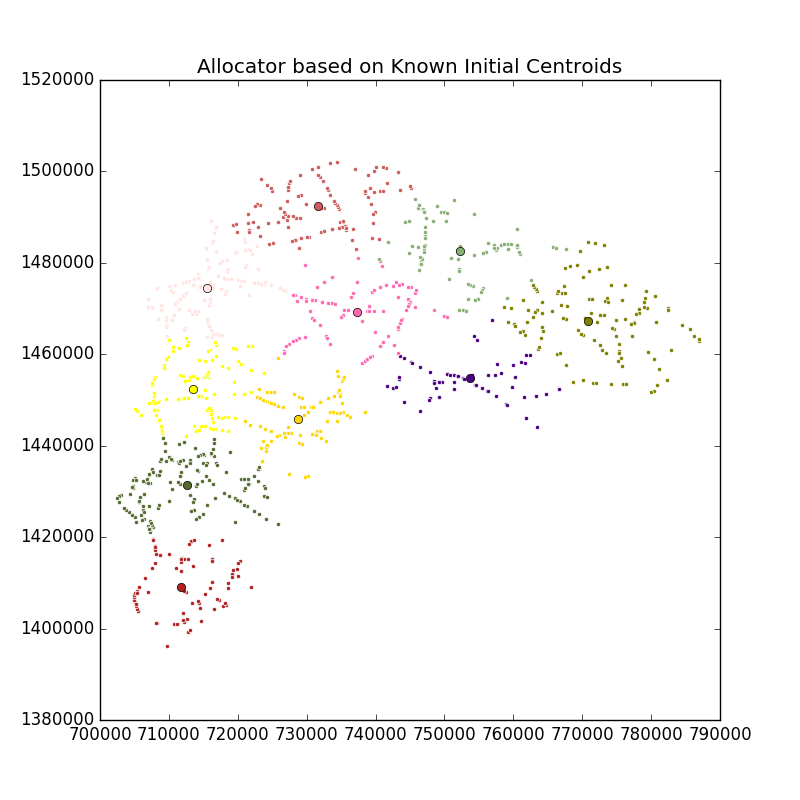
Known initial centroids allocator
positional arguments:
input Road segments input file
optional arguments:
-h, --help show this help message and exit
-c CENTROIDS, --centroids CENTROIDS
Known locations of the workers
-o OUTPUT, --output OUTPUT
Output file name
-d {euclidean,haversine,osrm,google}, --distance-func {euclidean,haversine,osrm,google}
Distance function for distance matrix
--plot Plot the output
--by-worker Alternative output format by worker
--osrm-base-url OSRM_BASE_URL
Custom OSRM service URL
--osrm-max-table-size OSRM_MAX_TABLE_SIZE
Maximum OSRM table size
--api-key API_KEY Google Map API Key
Examples
python -m allocator.sort_by_distance -c allocator/examples/sort-by-distance/worker-locations.csv allocator/examples/chonburi-roads-1k.csv --plot
The script takes a CSV file with worker locations (see a sample file) that contains two columns, lat (latitude) and lon (longitude).
Output file will be saved as sort-by-distance-output.csv if not specified by -o/--output
To see the plotting please specify –plot
If --by_worker option is specified, the output will look like this